Article
Why Do Networks Grow Hubs?
Connecting everyone directly needs a rapidly growing number of links, and a hub gives the same reach with far fewer. Whether a hub also lowers cost depends on how the network is run. The research shows that a hub is not the only design and that it has a price.
A puzzle to start
Picture 100 people who all need to be able to reach one another: to talk, to trade, to send a message. A link is any direct connection between two of them, such as a phone line, a road or an agreement.
If every person links to every other person, each of the 100 has 99 links. That counts every link twice, once from each end, so the total is 100 × 99 ÷ 2 = 4,950 links. If instead everyone links only to one person in the middle, a hub, the total is 99. For 1,000 people the numbers are 499,500 against 999. In general, linking everyone to everyone needs N(N−1)/2 links for N people. A hub needs N−1. The first number grows with the square of N. The second grows in step with N.
Costly links give networks an incentive to form hubs. How far does that idea go? This article separates what is proved, what is measured and what is still open.
The map: three ways to connect people
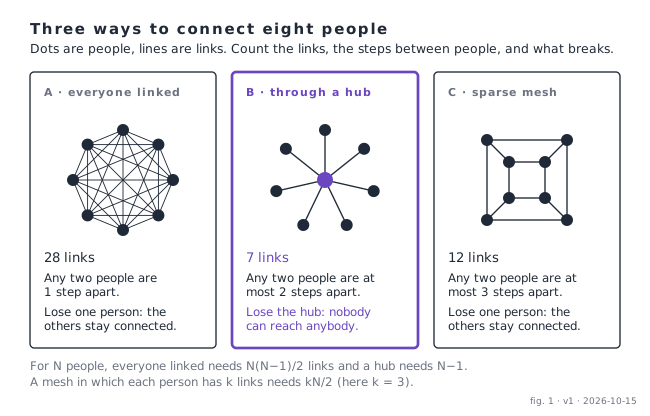
Figure 1. Three ways to connect eight people. Each card gives the number of links, the greatest number of steps between two people, and what happens if one person is lost.
Three questions sort any network of people: how many links it needs, how many steps separate two people (a step is one link crossed), and what breaks when one person disappears. In Figure 1, picture A needs the most links and gives the shortest paths. Picture B needs the fewest links but has one weak point, the hub. Picture C, where each person has only three links, needs more links than B, has no such weak point, and keeps everyone within three steps. The rest of the article places each finding on one of these three pictures.
What the arithmetic proves, and what it does not
Counting links alone does not favor a hub. If 100 people stand in a line and each links only to the next, a chain, the network also uses 99 links.
What favors the hub is distance. In the hub network any two people are at most two steps apart. In the chain, the average number of steps between two people is (N+1)÷3, which is about 33.7 steps for 100 people. In the hub network the average is 2(N−1)÷N, about 1.98.
A network that connects N people using only N−1 links is called a tree, and among trees the hub network, also called a star, has the shortest average distance. In any tree, exactly N−1 pairs of people are one step apart, namely the pairs that share a link. Every other pair is at least two steps apart. In the hub network, every other pair is exactly two steps apart. So no tree can have a smaller total distance than the hub network. Few links and short paths together make the hub attractive. The price is the weak point in picture B: if the hub fails, nobody can reach anybody.
When is a hub the best choice?
The economists Matthew Jackson and Asher Wolinsky studied a simple model of this question in 1996. Each person gains value from everyone they can reach, but the value shrinks with every step along the way. Let c be the cost each person pays for each link they hold, so every link costs two people c each. The paper asks which networks are best overall and which networks people would form for themselves.
Take ten people. Suppose a contact one step away is worth 0.8 to a person, one two steps away 0.64, three steps 0.512, and so on, so each extra step keeps 80%. Figure 2 shows what is best, as the cost of a link varies.
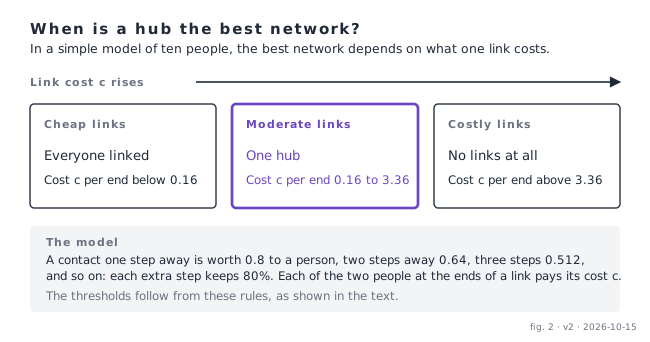
Figure 2. When is a hub the best network? In this ten-person example, everyone linked is best when links are cheap, one hub for a middle range of costs and no links when costs are high.
The model gives two cost thresholds, which follow from its rules for this ten-person example. In a hub network, two people who are not the hub are two steps apart. A direct link between them would raise each one's value from 0.64 to 0.8, a gain of 0.16. So once a link costs each end less than 0.16, adding those links pays and everyone ends up linked to everyone. At the other end, the hub network's contact values add up to 60.48 for the ten people, and its nine links cost c at each end. That is 18 link ends in all, so the hub network is worth having while 18c stays below 60.48, that is, while c is below 3.36.
A later paper that generalizes the Jackson–Wolinsky model states that the only networks that can be best are still the complete one, where everyone is linked to everyone, and the hub, apart from the empty network and one rare tie. The 1996 paper adds a second finding: the networks that self-interested people would sustain and the networks that are best overall do not always coincide. Both results concern stylized models, and real costs and benefits are messier.
A hub is not the only cheap network
Picture C shows another solution: connect each person to a few others, with no central hub. Mathematicians have studied networks in which each of n people has the same small number r of links, chosen at random. In 1982 Béla Bollobás and Wenceslas Fernandez de la Vega gave upper and lower bounds on the greatest number of steps between two people in almost every such network. Later papers summarize their result, for r of at least 3, as growth like the logarithm of n. Logarithmic growth is slow: multiplying the number of people by a thousand adds only a fixed number of steps.
The cost is longer paths than a hub gives. A well-connected mesh can avoid the hub's single point of failure: in the cube of picture C, removing any one person leaves the others connected. Not every sparse network is so resilient, since a mesh with a bottleneck can still be split by losing one person.
Hubs can also appear without anyone planning them. In 1999 Albert-László Barabási and Réka Albert showed that two simple ingredients reproduce the uneven link counts seen in many large networks: networks keep growing, and newcomers prefer to link to people who are already well connected. A few nodes then end up with very many links.
Evidence from the Internet
These models describe possible networks. The Internet lets us see how a large network has changed in practice.
The Internet is not one network. It is a collection of separately run networks, around 75,000 of them in 2023, called autonomous systems, which must agree on how to exchange traffic. They connect in two main ways. In transit, a customer network pays a provider network for connectivity. In peering, two networks exchange traffic directly, normally without payment. Many networks also meet at shared facilities called Internet exchange points.
An engineering standard shows the hub idea in use. Networks tell one another which destinations they can reach through exchanges of routing information, each over its own connection called a session. At an exchange point, every pair of networks that wants to swap routing information needs its own session, and the standard, RFC 7948 (2016), says the overhead of doing this for all pairs "scales quadratically". It describes a route server, a computer that passes routing information among all the networks at the exchange, and says it reduces the number of sessions from n(n−1)/2 to n. The route server "does not forward traffic itself", so the route server shares information about available routes while the networks send their traffic directly to one another. The standard also recommends running several route servers, which guards against the hub failing.
The Internet also shows direct links growing alongside hubs. Figure 3 uses counts from a RIPE Labs article by Savvas Kastanakis, which draws on CAIDA's relationship data. Peering links were 878 of 6,475 observed links (14%) in 1998 and 341,363 of 494,508 (69%) in 2023, while the number of networks grew from 3,549 to 75,160.
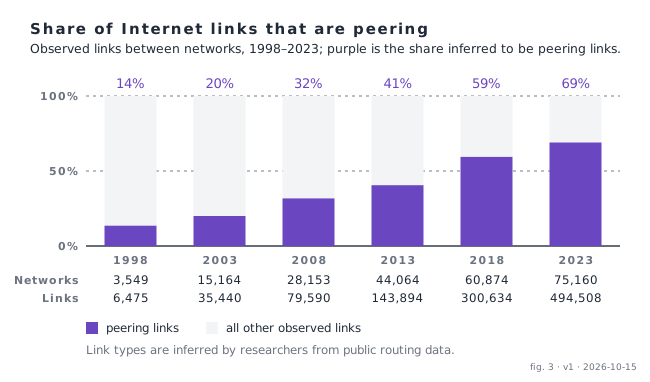
Figure 3. Share of Internet links that are peering. Peering rose from 14% of observed links in 1998 to 69% in 2023; the percentages are computed from the counts shown.
A fully linked Internet of 75,160 networks would need about 2.8 billion links. The 494,508 observed links are 0.0175% of that number.
Two cautions apply. First, these link types are inferred by researchers from public routing data. For its main relationship dataset, CAIDA infers customer-provider links first and labels the remaining links as peering; a second version adds peering links found by other methods. CAIDA notes that its coverage is limited by the public measurement points it relies on, and that customer-provider links are normally visible in public routing tables, which is why the second version looks elsewhere for peering links. Some of the rise in the peering share could therefore come from better observation, and the sources do not say how much. The RIPE Labs article reads the rise as the flattening of the Internet, which it ties to content providers, content delivery networks and exchange points.
Second, the hierarchy did not disappear. Dhamdhere and Dovrolis argued in 2010 that the Internet was moving from a tiered hierarchy of transit toward a dense mesh of peering, and built a model of how networks choose providers and partners given traffic, geography and the prices of transit and peering. A study of ten years of exchange-point growth by Böttger and colleagues found that routes partly moved away from the largest transit networks toward paths through exchange points, but that paths shortened only slightly and a small group of highly central networks still dominates. That study is a preprint.
The economics of peering are simple. If a direct link costs a fixed amount per year and each gigabyte sent through a middleman costs a bit more than sending it directly, the direct link becomes cheaper once the yearly traffic between the two networks passes the fixed cost divided by that extra price. Small flows favor a hub, and large flows favor a direct link.
These counts say nothing about how much traffic the biggest networks carry, so they do not show whether control over the Internet became more concentrated or less.
Evidence from Bitcoin and Ethereum
The Internet shows how networks balance shared infrastructure with direct connections. Bitcoin and Ethereum raise a related question: can a network share infrastructure without giving one institution control over it?
A bank keeps the authoritative record of its customers' money. Bitcoin was designed to process payments without relying on such a trusted central institution. Its 2008 paper proposes a "purely peer-to-peer version of electronic cash" that lets payments go "directly from one party to another without going through a financial institution". Independent computers maintain and check a common record of transactions. The paper says the network "requires minimal structure": messages are broadcast on a best-effort basis, and computers may leave and rejoin at will. It does not say how many links each computer keeps, so it does not fix the network's shape. Ethereum extends the idea: its shared record can also run programs, called smart contracts.
The economists Christian Catalini and Joshua Gans identify two key costs that the technology affects: the cost of verification and the cost of networking, that is, of coordinating a marketplace without a central intermediary. They argue that this can lower entry barriers, but that it also brings new inefficiencies and governance challenges.
Studies of these systems find hubs forming anyway.
- A payment layer. The Lightning Network, launched on Bitcoin in January 2018 to help it handle more payments, was studied by Stefano Martinazzi and Andrea Flori over its first year. They found a centralized configuration with a few highly active nodes acting as hubs. Removing those nodes is likely to cause a remarkable drop in the network's efficiency, while the network appears robust to random disruptions.
- Mining pools. Bitcoin miners, the computers that compete to add the next batch of transactions, often join pools to share risk. Lin William Cong, Zhiguo He and Jiasun Li found that this need not undermine decentralization. In their model, larger pools charge higher fees, attract disproportionately fewer miners and grow more slowly, and they report supporting evidence from Bitcoin mining.
- Ethereum block builders. Burak Öz and colleagues found that about 90% of Ethereum blocks come from an auction in which specialized firms compete to assemble them, and that between October 2023 and March 2024 three builders produced 80% of those blocks.
- Private information. Pablo Azar, Adrian Casillas and Maryam Farboodi report, in a Federal Reserve Bank of New York working paper using Ethereum data, that a 1% rise in the value of an intermediary's private information raises its profit share by 0.57%. They conclude that markets described as decentralized can develop oligopolies on their own.
Concentration of a service does not necessarily mean control of the whole network. But a builder decides which transactions go into the blocks it assembles and in what order, so a few firms running a concentrated service may gain power over how transactions are processed, even when the network's rules stay decentralized. The studies cited here measure market shares, profits and network position, not that power.
What the research does not show
- No law of network growth. Nothing cited here shows a single rule for how the number of links grows with the number of networks.
- Concentration of control is unmeasured. The Internet counts above are about links, not traffic or control.
- Several sources are early. The Azar et al. paper is a preliminary working paper, and the study of exchange points is a preprint. The Jackson–Wolinsky example is a deliberately simple model.
The map, completed
A complete network (picture A) gives direct contact at a high cost in links. A star (picture B) uses the fewest links of any connected network and keeps paths short, but depends on its center. A sparse mesh (picture C) can avoid that dependence at the price of longer paths.
Real networks can combine these structures. On the Internet, a hub serves where a shared facility saves effort, as with the route server at an exchange point, and direct links grow where traffic justifies them. Studies of Lightning, Ethereum block building and private information find hubs forming within systems designed to avoid central control.
The Internet and cryptocurrencies suggest a further distinction: a network can share infrastructure without having to give one institution control over it, although a concentrated service may still hold power over how transactions are processed. The numbers cited here leave the main question open: when a hub forms, does the network become dependent on whoever runs it? The question is not only why networks form hubs. It is when the benefits of a hub justify the dependence it creates.
Further reading
- Azar, P. D., Casillas, A., & Farboodi, M. (2024, rev. 2025). Natural centralization in decentralized finance. Federal Reserve Bank of New York Staff Reports, no. 1102. https://doi.org/10.59576/sr.1102
- Barabási, A.-L., & Albert, R. (1999). Emergence of scaling in random networks. Science, 286(5439), 509–512. https://doi.org/10.1126/science.286.5439.509
- Bollobás, B., & Fernandez de la Vega, W. (1982). The diameter of random regular graphs. Combinatorica, 2(2), 125–134. https://doi.org/10.1007/BF02579310
- Böttger, T., Antichi, G., Fernandes, E. L., di Lallo, R., Bruyere, M., Uhlig, S., Tyson, G., & Castro, I. (2019). Shaping the Internet: 10 years of IXP growth. arXiv preprint (v3). https://doi.org/10.48550/arXiv.1810.10963
- Buterin, V. (2014). Ethereum white paper: A next-generation smart contract and decentralized application platform. https://ethereum.org/en/whitepaper/
- CAIDA. AS relationships dataset. https://www.caida.org/catalog/datasets/as-relationships/
- Catalini, C., & Gans, J. S. (2016, rev. 2019). Some simple economics of the blockchain. NBER Working Paper 22952. https://doi.org/10.3386/w22952
- Cong, L. W., He, Z., & Li, J. (2021). Decentralized mining in centralized pools. The Review of Financial Studies, 34(3), 1191–1235. https://doi.org/10.1093/rfs/hhaa040
- Dhamdhere, A., & Dovrolis, C. (2010). The Internet is flat: Modeling the transition from a transit hierarchy to a peering mesh. Proceedings of the 6th International Conference on Emerging Networking Experiments and Technologies (CoNEXT '10), 1–12. https://doi.org/10.1145/1921168.1921196
- Hilliard, N., Jasinska, E., Raszuk, R., & Bakker, N. (2016). Internet Exchange BGP Route Server Operations. RFC 7948. https://doi.org/10.17487/RFC7948
- Jackson, M. O., & Wolinsky, A. (1996). A strategic model of social and economic networks. Journal of Economic Theory, 71(1), 44–74. https://doi.org/10.1006/jeth.1996.0108
- Kastanakis, S. (2023–24). 20 years of inferring interdomain routing policies. RIPE Labs, Table 1 (the counts in Figure 3). https://labs.ripe.net/author/savvas-kastanakis/20-years-of-inferring-interdomain-routing-policies/ The article summarizes: Kastanakis, S., Giotsas, V., Livadariu, I., & Suri, N. (2023). Replication: 20 years of inferring interdomain routing policies. Proceedings of the 2023 ACM Internet Measurement Conference, 16–29. https://doi.org/10.1145/3618257.3624799
- Martinazzi, S., & Flori, A. (2020). The evolving topology of the Lightning Network: Centralization, efficiency, robustness, synchronization, and anonymity. PLOS ONE, 15(1), e0225966. https://doi.org/10.1371/journal.pone.0225966
- Nakamoto, S. (2008). Bitcoin: A peer-to-peer electronic cash system. https://bitcoin.org/bitcoin.pdf
- Olaizola, N., & Valenciano, F. (2020). Characterization of efficient networks in a generalized connections model with endogenous link strength. SERIEs, 11(3), 341–367. https://doi.org/10.1007/s13209-020-00212-6
- Öz, B., Sui, D., Thiery, T., & Matthes, F. (2024). Who wins Ethereum block building auctions and why? 6th Conference on Advances in Financial Technologies (AFT 2024), LIPIcs 316, article 22. https://doi.org/10.4230/LIPIcs.AFT.2024.22